Why does GOMEMLIMIT take up significant physical memory for unused virtual memory?
While debugging memory bloat in a Go application recently, I found that removing the GOMEMLIMIT soft memory limit and disabling transparent huge pages partially mitigated the issue. However, I couldn't fully explain why these changes worked. So I thought why not ask the internet about it.
A simplified memory bloat program
The following Go program vm-demo.go demonstrates memory bloat by allocating a 400 MiB slice every second. It saves references to the slices without any read or write operations.
 1func main() {
 2  var d [][]byte
 3  time.Sleep(3 * time.Second) // sleep 3 seconds for the collection script to find PID.
 4  for range 200 {
 5    d = append(d, make([]byte, 8*50*1024*1024)) // 400 MiB
 6    time.Sleep(time.Second)
 7    // Reference d, in case compiler optimizes d away.
 8    fmt.Println(len(d))
 9  }
10}
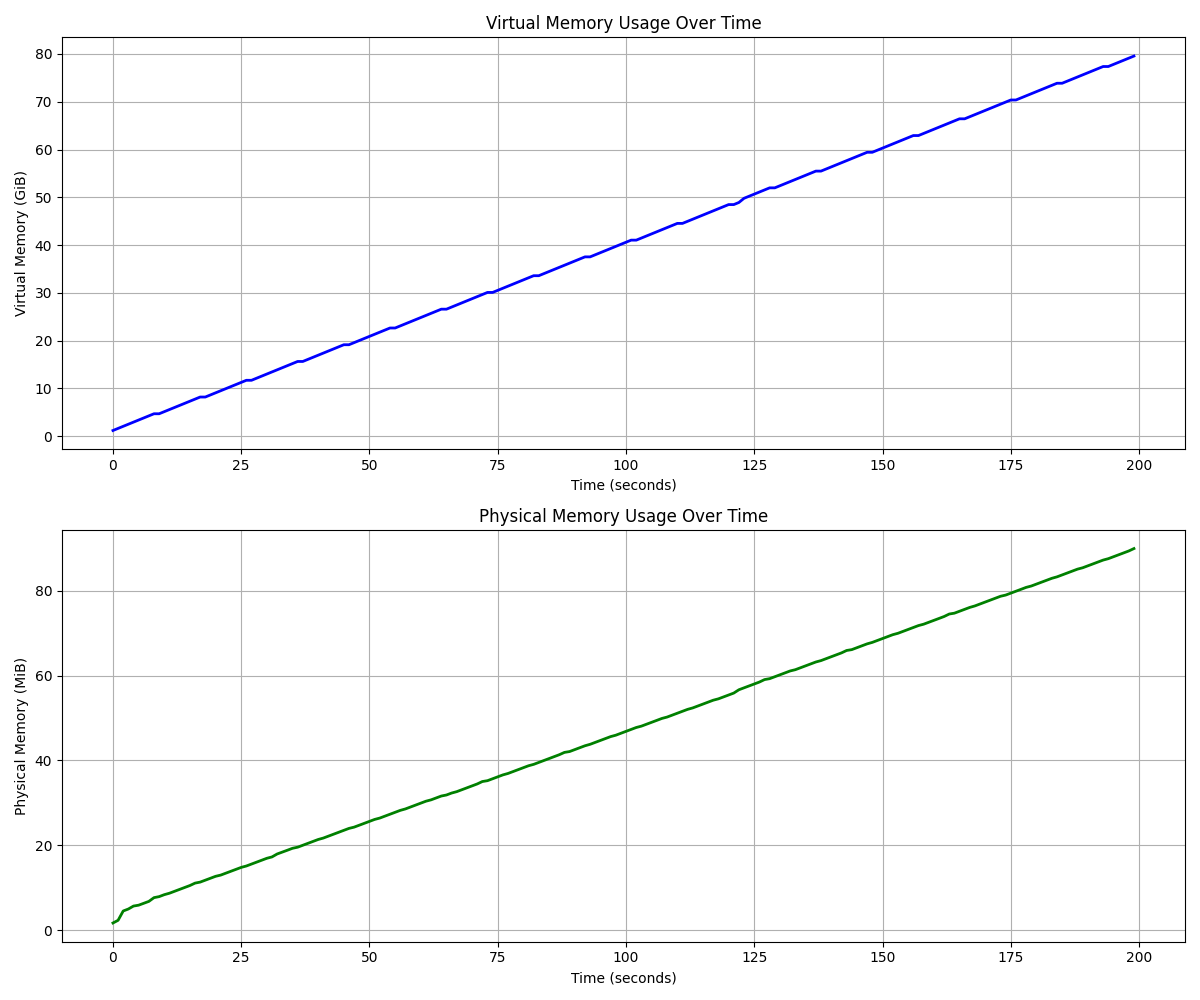
I build this program with default go build settings (no additional flags). To monitor its memory usage, I collect virtual memory size (VmSize) and physical memory size (VmRSS) every second from /proc/${PID}/status, then plot these measurements over time.
Use the collect.sh and plot-memory-usage.py to reproduce.
Test Environment:
- OS: Amazon Linux 2023 (AMI: ami-093a4ad9a8cc370f4, al2023-ami-2023.6.20250115.0-kernel-6.1-x86_64)
- EC2 Instance: m6a.2xlarge
- Go version: 1.23.5
- Configuration: Swap memory disabled, transparent_hugepage set to madvise
./vm-demo

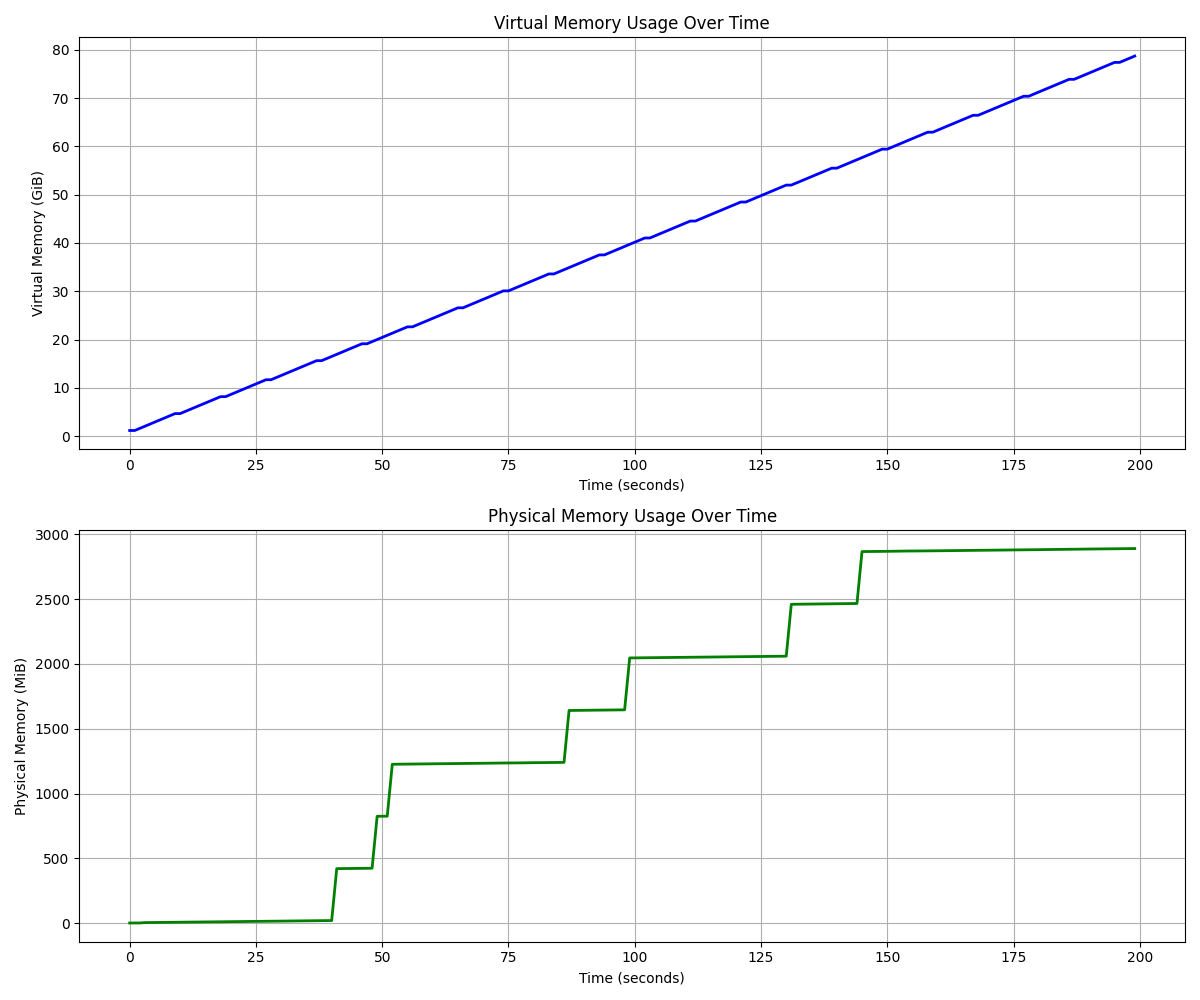
GOMEMLIMIT=2048MiB ./vm-demo

Until Go 1.19, GOGC was the sole parameter that could be used to modify the GC behavior. While it is a trade-off between GC and memory usage, it doesn't take into account that available memory is finite. Go 1.19 introduces the GOMEMLIMIT variable that sets a soft memory limit for the runtime. This memory limit includes the Go heap and all other memory managed by the runtime, and excludes external memory sources such as mappings of the binary itself, memory managed in other languages, and memory held by the operating system on behalf of the Go program. Together, GOGC and GOMEMLIMIT provide better control over garbage collection behavior. More details in the Go runtime.
In our demo, setting GOMEMLIMIT=2048MiB triggers garbage collection with each 400MiB allocation. Since there's no garbage to collect, I expect GOMEMLIMIT does not impact physical memory. However, an unexpected behavior emerges: physical memory usage climbs to 3GiB, 34 times of the 90MiB observed without GOMEMLIMIT. Why?
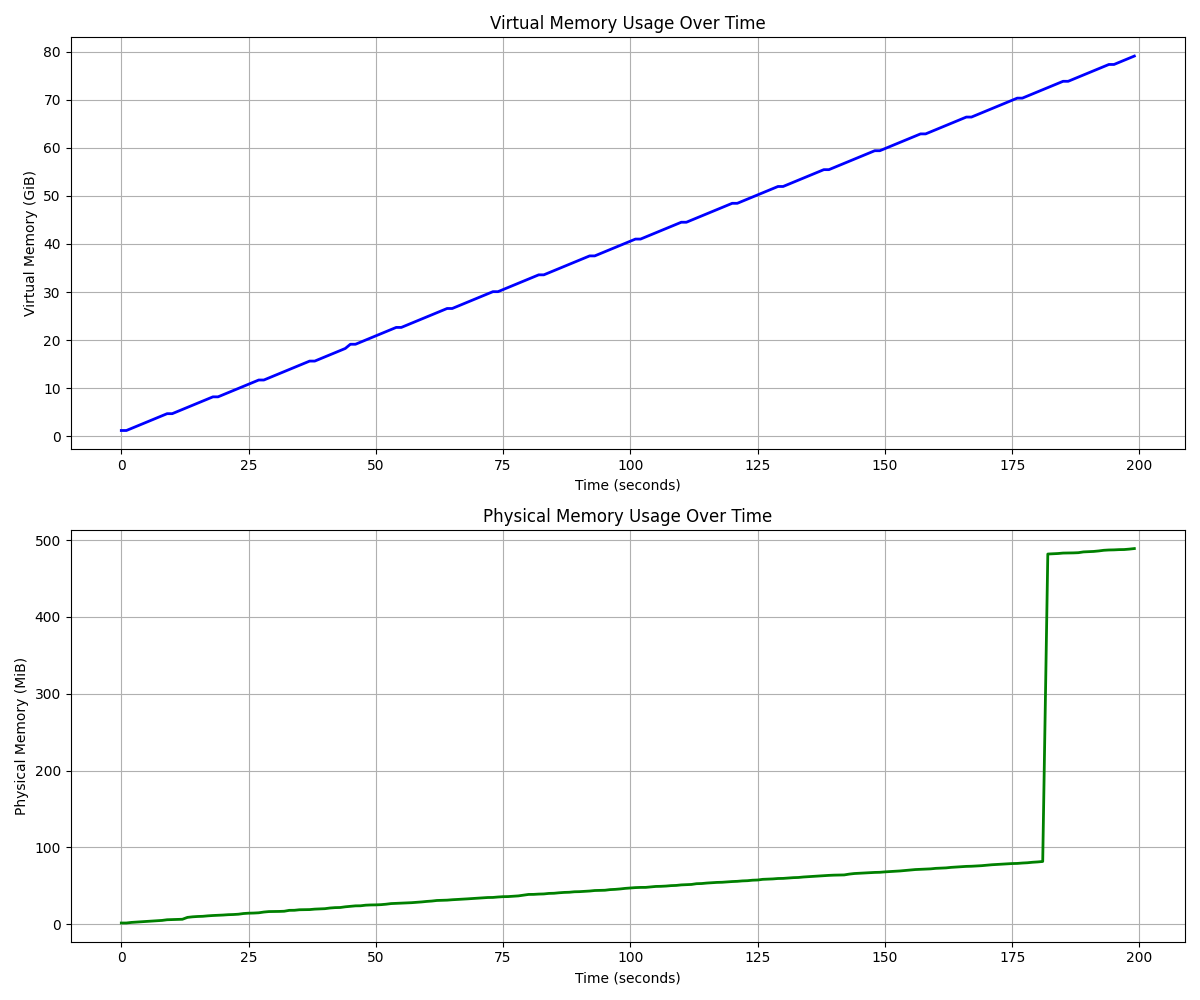
GODEBUG=disablethp=1 GOMEMLIMIT=2048MiB ./vm-demo

Transparent huge pages (THP) is a Linux feature that transparently replaces pages of physical memory backing contiguous virtual memory regions with bigger blocks of memory called huge pages. By using bigger blocks, fewer page table entries (PTE) are needed to represent the same memory region, improving lookup times both in TLB and page tables. Applications with small heaps tend not to benefit from THP and may end up using a substantial amount of additional memory (as high as 50%). However, applications with big heaps (1 GiB or more) tend to benefit quite a bit (up to 10% throughput) without very much additional memory overhead (1-2% or less). More details in the GC guide.
In our demo, disabling THP initially shows promising results, with physical memory staying low up to 70 GiB of virtual memory allocation. However, a sudden spike to 500 MiB of physical memory usage occurs at this point, raising questions about the underlying memory management behavior. Why?
Verifying physical memory usage with OOM killer
The surprising jumps in VmRSS led me to question whether it accurately reflects the process's physical memory usage. To verify this, I tested the program against Linux's OOM (Out Of Memory) killer using systemd's memory limits:
1# sudo systemd-run --scope -p MemoryMax=200M -E GOMEMLIMIT=2048MiB ./vm-demo
2Running scope as unit: run-r40a3457cc26f49549e7107916251736e.scope
31
42
5...
646
7Killed
The system logs confirmed the OOM kill:
1# journalctl -fu run-r40a3457cc26f49549e7107916251736e.scope
2Jan 19 23:44:13 systemd[1]: Started run-r40a3457cc26f49549e7107916251736e.scope - /home/ec2-user/vm-demo.
3Jan 19 23:44:50 systemd[1]: run-r40a3457cc26f49549e7107916251736e.scope: A process of this unit has been killed by the OOM killer.
4Jan 19 23:44:50 systemd[1]: run-r40a3457cc26f49549e7107916251736e.scope: Killing process 12560 (vm-demo) with signal SIGKILL.
5Jan 19 23:44:50 systemd[1]: run-r40a3457cc26f49549e7107916251736e.scope: Failed with result 'oom-kill'.
Conclusion
The behaviors in Figure 2 (unexpected 3GiB physical memory usage with GOMEMLIMIT) and Figure 3 (low memory usage until 70GiB virtual memory, followed by a 500MiB spike) are surprising. And behaviors may vary across different Go versions. To get to the bottom of it, I probably need to dive into Go source code. Let me know if you have any idea here.